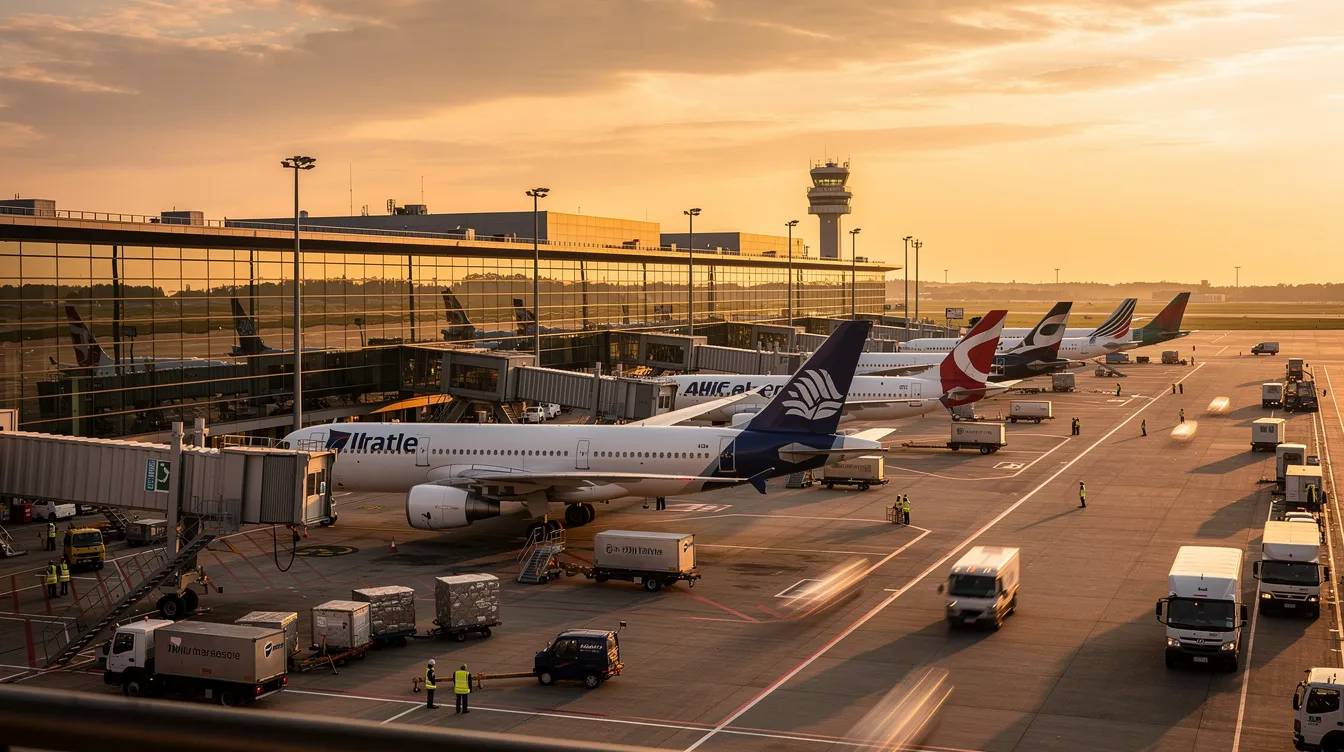
Thousands of commercial flights depart every day across the globe. Yet the number of aviation accidents that qualify as plane crashes remains remarkably small, and shrinking. This article breaks down the actual data behind average plane crashes per year, separates commercial aviation from general aviation, and explains what these aviation statistics mean for anyone who boards an aircraft in 2026.
Quick Answer: How Many Plane Crashes Happen Per Year?
Globally, there are roughly 50 to 100 aircraft accidents per year involving scheduled commercial flights with larger aircraft (above approximately 5,700 kg maximum takeoff weight). Of those, only a handful are fatal accidents. In 2024, the International Civil Aviation Organization recorded 95 accidents in scheduled commercial operations worldwide, with 10 of those classified as fatal, resulting in 296 passenger fatalities.
In the United States, the picture is broader. NTSB data from 2005 to 2024 show that U.S. civil aviation typically logs between 1,200 and 1,400 aviation accidents annually when all categories are counted: scheduled airlines, air taxis, commuter flights, and general aviation. The vast majority of those, about 80 to 90 percent, involve general aviation aircraft rather than commercial airline operations. General aviation aircraft are involved in 78% of U.S. crashes. Fatal crashes in scheduled commercial airline service are now rare events, particularly in North America and Europe. As of 2025, major commercial passenger jet accidents occur so infrequently that multiple recent years have passed with zero onboard passenger fatalities on U.S. carriers. BlackJet operates within this same rigorous safety framework, applying the standards that have made modern air travel one of the safest forms of long-distance transportation.
Annual Aviation Accident Snapshot
Measure | Annual figure or rate | Scope and context |
|---|
Global scheduled commercial accidents (2024) | 95 | ICAO-recorded accidents involving scheduled commercial operations |
Fatal scheduled commercial accidents (2024) | 10 | Included in the 95 total accidents |
Passenger fatalities in scheduled commercial operations (2024) | 296 | Global figure reported by ICAO |
Global commercial aviation accidents (2025) | 51 | IATA total across commercial aviation |
Fatal commercial aviation accidents (2025) | 8 | Resulted in 394 onboard fatalities |
U.S. civil aviation accidents | About 1,200–1,400 | All categories combined, including general aviation and air taxis |
U.S. general aviation accidents (2023) | 1,097 | AOPA-reported total, including 186 fatal accidents |
U.S. general aviation fatal accidents (2024) | 179 | Resulted in 306 fatalities |
Global commercial accident rate (2025) | 1.32 per million flights | Roughly one accident per 5 million flights |
These figures use different definitions, years, and operating categories, so they should not be added together or treated as direct comparisons. The table offers a quick reference; the sections below explain what each statistic includes and why the distinction matters.
Understanding Aviation Accidents vs. Incidents
Not every in-flight problem counts as an aviation accident. Under U.S. federal regulation (49 CFR § 830.2), an aircraft accident requires at least one of three outcomes: a person suffers death or serious injury, the aircraft sustains substantial damage, or the aircraft is removed from service. An airplane crash that results in a gear-up landing with minor cosmetic damage, for instance, may not meet this threshold.
An aviation incident is a lesser occurrence that affects or could affect flight safety but does not produce major damage, serious injury, or death. Near-misses, equipment anomalies, and operational irregularities fall into this category. Because global organizations like ICAO and the International Air Transport Association (IATA) restrict their accident tracking to scheduled commercial flights above certain weight thresholds, many smaller general aviation aircraft events do not appear in headline statistics. All aviation categories must be considered separately when assessing worldwide plane crash totals due to differing risk factors. Focusing on the formal accident definition, rather than every technical issue, gives a clearer and more accurate picture of real-world risk in air travel.
Global Aviation Accidents Per Year: Long-Term Trends
Aviation crashes have decreased sharply since the 1970s, even as the number of annual passengers has grown from hundreds of millions to nearly five billion. The Bureau of Aircraft Accidents Archives logged more than 11,000 aircraft accidents worldwide from 1970 to 2023, totaling approximately 83,772 fatalities across all aircraft types. During the 1970s and 1980s, annual accident counts often exceeded 400 to 500 for larger aircraft globally. Since 2009, that number typically falls below 170 per year.
The decline in accident rates per departure is even steeper. The accident rate declined from 3.72 accidents per million flights in 2005 to 1.32 in 2025, according to the International Air Transport Association. The global commercial accident rate was 1.32 per million flights in 2025, translating to roughly 1 accident per 5 million commercial flights. There were 51 total commercial aviation accidents in 2025, with 8 fatal accidents resulting in 394 onboard fatalities. In 2023, commercial aviation recorded the lowest fatalities ever in a single calendar year, with just 72 deaths in scheduled commercial flights globally. The average number of airline accidents involving passenger fatalities has halved roughly every 10 years over the last 30 years. The global all-accident rate typically hovers around 1.2 to 1.4 accidents per million flights.
Regional differences persist. Western and Central Africa recorded accident rates near 12 to 13 per million sectors in 2024, while Europe and North America sat around 1.3 to 1.5 per million. These gaps reflect differences in infrastructure, fleet age, and regulatory oversight; the global average continues to fall as developing regions modernize.
U.S. Plane Crashes Per Year: Civil Aviation Snapshot
The National Transportation Safety Board tracks every civil aviation accident in the United States, making U.S. data among the most comprehensive available for studying average plane crashes per year.
Across all categories, U.S. civil aviation averages 1,200 to 1,400 aviation accidents annually. "Civil aviation" covers a wide range: private recreational flying, flight training, emergency medical flights, agricultural operations, air taxis, commuter services, and Part 121 scheduled commercial airlines. Within this total, general aviation accounts for the vast majority of aircraft accidents. The AOPA's 35th Richard G. McSpadden Report documented 1,097 general aviation accidents in the U.S. in 2023 alone, including 186 fatal accidents. In 2024, general aviation had 179 fatal accidents with 306 fatalities. Meanwhile, airline flight operations under Part 121 contribute a small fraction of the overall count, and the NTSB's accident dashboard (2008 to 2024) shows a gradual reduction in serious accident rates across all categories, even as traffic volumes remain high.
Commercial Airline Crashes vs. General Aviation Accidents
Scheduled commercial airline operations and general aviation occupy different safety universes. Commercial aircraft fly under Part 121 (or equivalent international standards), with multi-person flight crews, structured standard operating procedures, recurrent simulator-based pilot training, and tightly regulated maintenance standards. These factors combine to produce accident rates orders of magnitude lower than general aviation.
General aviation aircraft are involved in 78% of aviation crashes in the United States. This category includes private pilots, recreational flyers, flight schools, and specialized operations like agricultural spraying and ferry flight repositioning. The aircraft type ranges from single-engine piston planes to small turboprops, flown by pilots with widely varying experience levels. The fatal accident rate for general aviation is 1.049 per 100,000 flight hours, compared to commercial aviation, which averages approximately 44 accidents and 6 fatal accidents per year globally across tens of millions of flights. For a deeper look at why smaller aircraft see higher accident numbers, see Why Do Small Planes Crash So Often.
Despite these statistics, general aviation safety has improved over time. AOPA data shows the GA accident rate dropped from 4.3 to 3.86 per 100,000 flight hours between 2022 and 2023. BlackJet operates as a curated, vetted private aviation platform built closer to commercial airline safety standards than casual private flying, bridging the gap between general aviation and scheduled commercial operations.
Average Fatal Plane Crashes Per Year and Risk Metrics
Only a subset of aviation accidents result in fatalities. For scheduled commercial flights, the world now sees fatal commercial accidents averaging around 5 to 10 per year globally. Some years see fewer. In 2023, there was a single fatal accident in that category worldwide. In 2024, ten. In 2025, eight.
The global accident rate for commercial flights is 1 accident per 5 million flights. ICAO reported 65 fatalities per billion passengers in 2024 for scheduled commercial operations, while 2023 dropped to just 17 fatalities per billion passengers. U.S. commercial airlines had zero fatalities in multiple recent years under Part 121 scheduled service.
The odds of dying in a plane crash are 0.000008%. Daily flying now has a statistically decreased risk of a fatal accident compared to previous decades. To put that in perspective: flying is about 560 times safer per million hours than driving. The fatality rate gap between commercial air travel and road travel is so wide that for frequent travelers, the drive to the airport carries more statistical risk than the flight itself.
Decade-by-Decade: How Fatal Accident Rates Fell
The 1970s and 1980s saw multiple fatal airline accidents per year globally, with limited redundancy in aircraft systems, less advanced navigation, and cockpit resource management still in its infancy. American Airlines Flight 191 in 1979, which killed 273 people after an engine separated on takeoff from Chicago O'Hare, became a catalyst for overhauling engine-mount inspection protocols and emergency procedures. That era's safety record reflected the technology and training of its time.
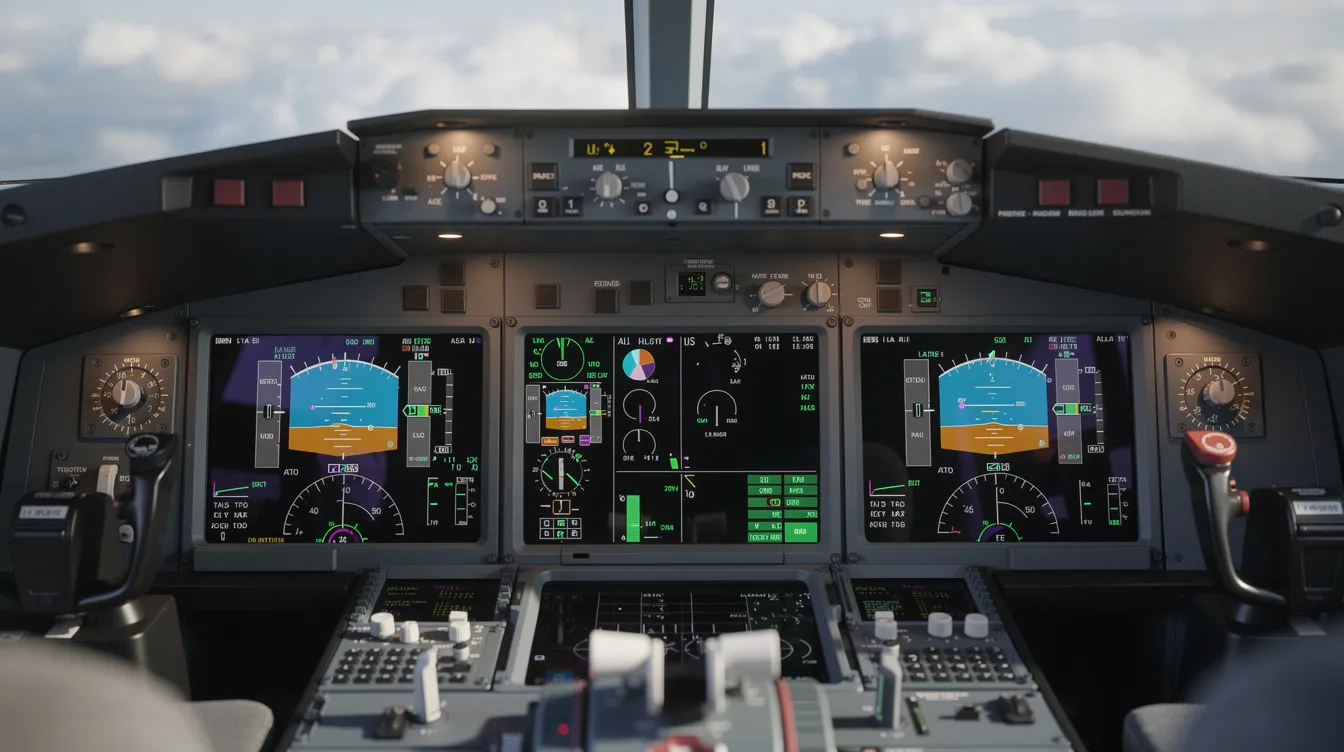
By the 1990s, accident numbers began falling as manufacturers improved aircraft design, airlines adopted crew resource management, and regulators required enhanced ground-proximity warning systems. Yet catastrophic events still punctuated the decade. TWA Flight 800 broke apart over Long Island Sound in 1996, killing all 230 aboard due to a fuel tank explosion; the subsequent investigation led to fuel tank inerting requirements across the commercial fleet. The 2000s continued the downward trend. Colgan Air Flight 3407, which crashed shortly after departure near Buffalo, New York, in February 2009, killing all 49 on board and one person on the ground, was the last fatal crash for a U.S. Part 121 scheduled passenger flight for nearly a decade. That accident resulted in sweeping changes to pilot training hours and fatigue rules.
The 2010s and 2020s represent the safest period in aviation history. Several years recorded zero fatalities on major U.S. carriers, and 2023 set a global record low for commercial aviation fatalities. Measured per million departures, fatal accident rates have fallen by roughly 70 to 80 percent from the early jet age to today. Improvements in aviation safety have been driven by better technology, pilot training, and safety regulations working in combination across the industry.
When Crashes Happen: Flight Phases and Risk Concentration
Aviation accidents are not spread evenly across a flight. Nearly half of all aviation incidents occur during takeoff and landing phases. Nearly half of aviation crashes occur during landing or takeoff specifically, despite those phases accounting for only a small fraction of total flight time.
The reasons are concrete. During approach and departure, pilots manage higher workloads: changing aircraft configuration (gear, flaps), navigating closer to terrain, responding to air traffic control instructions, and contending with wind shear, icing, wake turbulence, and adverse weather conditions. A flight crew executing an approach in poor weather conditions at an unfamiliar airport faces a compressed timeline where a single misjudgment can cascade. Severe turbulence and microbursts add layers of complexity.
En route cruise, which constitutes the majority of flight time, carries the lowest accident rate per hour. This distribution explains why modern avionics, automation, and training focus heavily on approach and departure procedures. Systems like enhanced ground-proximity warning and stabilized approach criteria exist precisely because risk concentrates in these brief windows.
Common Causes of Aviation Accidents and Fatal Crashes
Understanding why aviation accidents happen clarifies why average crash numbers have declined. The cause profile has shifted over decades.
In earlier eras, mechanical failures dominated: structural fatigue, engine failure, in-flight fire, and hydraulic system breakdowns. Mechanical failures account for roughly 21% of tracked aviation accidents historically, but that share has shrunk as materials science, redundant system design, and predictive maintenance have improved. Today, human error and human factors play a larger role. Pilot error, insufficient training, poor situational awareness, and breakdowns in crew coordination now figure in the majority of fatal crash investigations. Controlled flight into terrain, once a leading killer, has been sharply reduced by terrain awareness warning systems.
Weather conditions can influence accident frequency in aviation. Thunderstorms, icing, low visibility, and microbursts all remain contributing factor categories. Delta Air Lines Flight 191 in 1985 encountered a microburst on approach to Dallas/Fort Worth, killing 137 people; the accident resulted in mandatory wind-shear detection equipment and revised pilot training for microburst encounters. Air travel has 0.01 deaths per 100 million miles traveled, a number that reflects the cumulative effect of addressing each of these cause categories systematically over decades.

Accident reports often describe specific events in plain terms: a plane overshot the runway, an aircraft collided with another aircraft, or a crew made an emergency landing after identifying a technical issue. An emergency landing does not necessarily mean a crash or indicate that passengers were harmed. In fatal reports, phrases such as “fatal crash involving” a particular aircraft or “crew aboard died” describe outcomes; other reports note that everyone on board survived or that people on board died. These details matter because each incident has a distinct cause and outcome. A fire truck may be dispatched as a precaution during an abnormal landing, which does not by itself mean there was a fire or an accident.
How Regulators and Investigators Reduce Average Crashes Per Year
The agency responsible for aviation accident investigation in the United States is the National Transportation Safety Board. In Europe, bodies like the BEA (France) and AAIB (UK) serve parallel roles. The FAA and EASA set and enforce operational rules. ICAO, the UN's aviation body, establishes global standards through annexes like Annex 13, which provides the framework for standardized accident investigation and reporting across member states.
Every fatal crash or major accident triggers an investigation that produces a probable cause determination and safety recommendations. These recommendations translate into regulatory changes. Traffic Collision Avoidance Systems are required after mid-air collisions demonstrated the need for automated separation alerts. After TWA Flight 800, the FAA mandated fuel tank inerting for new commercial aircraft. The FAA mandates cockpit voice recorders on all commercial aircraft, ensuring investigators have audio data from the flight deck. In 2016, ICAO mandated aircraft to report position every 15 minutes, closing a gap exposed by the disappearance of Malaysia Airlines Flight 370.
This cause-and-effect loop, from accident analysis to regulatory change to measurable decline, is the engine behind the long-term drop in average aviation crashes per year. Where reporting is incomplete or regulatory oversight is weak, the loop slows, and accident rates remain higher.
Regional Differences: Where Aviation Crashes Are More Likely
Global aviation safety has improved across every region, but accident rates per million flights still vary. Western and Central Africa recorded rates near 12 to 13 accidents per million sectors in 2024, according to IATA's regional safety data. Europe and North America sit around 1.3 to 1.5 per million. The gap traces to infrastructure quality, fleet age, the strength of regulatory oversight, and access to modern navigation and surveillance systems.
Asia-Pacific and Middle East operators have generally maintained low or rapidly improving accident rates as their commercial airline sectors modernize. South Korea, for instance, has invested heavily in aviation infrastructure and training, though the deadliest aviation disaster in recent Korean Air Flight history prompted sweeping cockpit culture reforms in the late 1990s. Conflict zones pose special risks: airspace closures, GNSS interference, and threats to navigation require robust route planning and NOTAM-based assessments before any flight.
Technology, GNSS Interference, and Modern Aviation Safety Systems
Technology is the primary driver behind the decline in average plane crashes per year, though it also introduces new challenges. Modern navigation depends heavily on GNSS (GPS, Galileo, and similar satellite systems). Between 2023 and 2025, reports of GNSS jamming rose approximately 67 percent, and spoofing incidents increased by over 190 percent, particularly in conflict-adjacent airspace.
Redundancy strategies limit the safety impact. Aircraft carry inertial navigation systems, traditional radio aids (VOR, NDB), and cross-check procedures that allow flight crews to revert to non-satellite navigation when interference is detected. The Global Aeronautical Distress and Safety System (GADSS) requires position reporting at regular intervals and moves toward continuous tracking for new aircraft to enhance safety and post-incident response. The Aviation Safety Reporting System collects voluntary safety incident reports from crew members, controllers, and maintenance personnel, capturing near-misses and system weaknesses before they become accidents. These overlapping layers of protection, from automated collision avoidance to voluntary confidential reporting, explain how the industry absorbs new threats without reversing its long-term safety gains.
Commercial Airlines, Cargo Flights, and Private Jet Operations: Safety Comparisons
The phrase "average plane crashes per year" spans different operation types: scheduled passenger flights, cargo flight operations, regional carriers, and private or charter aviation. Each carries a different risk profile.
Scheduled commercial airlines and large cargo operators share similar regulatory standards under Part 121 or equivalent frameworks. Both require professional flight crews, structured maintenance intervals, operational control centers, and recurring training. Their safety record reflects this rigor. U.S. commercial airlines often record zero onboard fatalities in given years. Smaller charter and air taxi operations fall under Part 135, where safety performance varies by operator quality. Some match commercial standards; others do not. General aviation, covering everything from recreational flights to agricultural and medical missions, carries the highest accident rates but also the widest range of activities, aircraft, and pilot experience.
BlackJet's model sits at the structured end of private aviation: a curated network of vetted operators that meet standards approaching or matching commercial airlines. This includes strict maintenance, professional two-pilot crews on most missions, and robust safety certification. For travelers comparing options, the difference between ad hoc charter and a structured private jet safety program can be substantial, particularly for larger groups evaluating the best private jet options for around 20 passengers.
Interpreting Aviation Safety Statistics as a Traveler
Raw numbers like "95 accidents in 2024" can mislead without context. The more useful metrics are accidents per million flights, fatalities per billion passenger-miles, and lifetime odds. Commercial air travel produces approximately 0.01 deaths per 100 million miles traveled; car travel generates a rate many times higher. The safest form of long-distance transportation, by virtually any measure, is commercial air travel.
For travelers evaluating an airline or private operator, look beyond headline statistics. Safety culture, audit standards (such as ARGUS Platinum ratings or Wyvern certifications), fleet maintenance transparency, and pilot qualifications all matter. Comparing top private jet companies and how they approach safety and service can also clarify which operators align with your expectations. A flight attendant or one passenger noticing a safety gap and reporting it can prevent an accident; operators that encourage this reporting culture tend to perform better over time.
For high-net-worth travelers, shifting high-mileage trips from crowded commercial hubs or road travel to vetted private jets is a rational safety upgrade when done through a reputable platform with documented standards, especially once you understand the full private jet price list, costs, and access options.
Private Aviation, Jet Cards, and Enhancing Safety with BlackJet
Private aviation is a strategic tool for safety, efficiency, and operational control, not just comfort. For frequent business travelers and executives, the ability to avoid congested terminals, reduce connections, and fly direct to smaller airports cuts exposure to the operational complexity where risk concentrates. Depending on how often you fly, options like a 100-hour Jet Card structure and its total cost, a more flexible 25-hour Jet Card program, or an intermediate 50-hour Jet Card option can all be tuned to balance safety, convenience, and budget. For travelers wondering how private flying compares to airline travel from a risk perspective, understanding whether private jets are safe can further contextualize these choices.
Jet Card programs like BlackJet's work through prepaid blocks of flight hours, typically 25 or 50 hours, across multiple aircraft categories, sitting alongside other models such as unlimited private jet membership programs that offer fixed-fee access for extremely frequent flyers. Each flight draws from a network of operators vetted against strict safety criteria: modern avionics, documented maintenance standards, qualified two-pilot crews, and real-time operational support. BlackJet's premium private Jet Card programs are designed around this safety-first framework. BlackJet's digital booking tools allow proactive management of weather, route changes, and scheduling, giving travelers and their teams direct visibility into operational decisions.
Sustainability commitments are built into the program. Every BlackJet flight is carbon-neutral at no additional cost, reflecting a broader culture of responsibility that aligns with the industry's safety-first ethos and modern thinking on the cheapest private jet options for cost-conscious travelers.
Consider an executive flying from New York to London using the BlackJet 50 Jet Card, a structure similar in spirit to many 50-hour Jet Card programs and their pricing. Instead of navigating JFK's congestion, security lines, and potential delays, they board a large-cabin jet at a private terminal, fly direct, and arrive rested. Or a family traveling regionally across the Southeast on a light jet, one of the best small private aircraft options for short- to mid-range missions: two direct flights replace a four-leg commercial itinerary with overnight layovers, cutting total takeoffs and landings in half and eliminating time spent in busy hub airports.

Case Study Style Examples: When Private Jet Access Reduces Exposure
Minimizing connections, time in busy terminals, and overnight layovers does more than save time. It reduces the number of takeoffs and landings, the flight phases where nearly half of aviation crashes occur.
Example 1: Multi-leg commercial trip vs. direct private charter. A technology executive needs to travel from San Francisco to Austin and then to Miami in a single week. The commercial itinerary involves four flights, two connections through Dallas, and six total takeoffs and landings. Using a BlackJet mid-size jet, the same trip becomes two direct flights, three takeoffs and landings (including the repositioning leg), and no time spent in crowded terminals. Each eliminated connection removes one approach-and-departure cycle from the equation, a core strategy for anyone focused on flying private as affordably as possible or even buying a single seat on a private jet rather than chartering an entire aircraft.
Example 2: Time-sensitive medical cargo flight. A biotech firm needs to move temperature-sensitive samples from Boston to a lab in Raleigh-Durham within hours. An improvised arrangement through an unfamiliar broker introduces uncertainty about crew qualifications, aircraft maintenance history, and cargo hold temperature controls. For organizations balancing safety, timing, and budget, understanding the cheapest private aircraft and other budget-friendly options is useful, but those choices still need strong operational oversight. Using a vetted private operator through BlackJet's network, the firm books a flight on a known aircraft with a qualified crew, documented maintenance records, and six crew members or fewer operating under clear operational control. The difference is not just speed; it is predictability and accountability.
While commercial airline fatal crashes are already rare, private jet access through a reputable platform stacks the odds further by reducing operational complexity and placing every flight under consistent safety oversight.
FAQs: Average Plane Crashes Per Year and Traveler Concerns
How many commercial airline crashes happen per year globally?
Under scheduled commercial operations (ICAO and IATA criteria), there are roughly 50 to 100 accidents per year. Of those, fatal accidents typically number between 5 and 10. In 2025, IATA reported 51 total accidents and 8 fatal accidents across global scheduled commercial flights.
Are commercial airlines safer than private planes?
Yes. General aviation aircraft are involved in 78% of crashes in the United States, with a fatal accident rate of 1.049 per 100,000 flight hours. Scheduled commercial airlines average approximately 6 fatal accidents per year globally across tens of millions of flights. The gap narrows when private flights are operated by vetted, professionally managed companies with standards comparable to commercial carriers.
What are the odds my flight will be in a fatal crash?
For scheduled commercial flights, ICAO data shows 65 fatalities per billion passengers in 2024. An individual passenger's odds of being in a fatal crash on a given flight are roughly 1 in 15 million or lower, depending on route and carrier. In 2023, commercial aviation recorded the lowest fatalities ever.
Has aviation safety improved in the last 20 years?
The global accident rate for commercial flights fell from over 3 accidents per million flights in the early 2000s to 1.32 per million in 2025. Fatal accident rates dropped even faster. Multiple years have passed in which U.S. major carriers recorded zero fatalities across all scheduled flights involved in Part 121 operations.
How does a Jet Card like BlackJet's influence safety?
A well-structured Jet Card program works with vetted operators who apply commercial-grade maintenance, professional two-pilot crews, standardized safety audits, and modern avionics. This narrows the gap between private flying and commercial airline safety performance. Learn more about BlackJet's safety protocols.
Where can I find official aviation accident statistics?
Key sources include ICAO's periodic Safety Reports, IATA's Annual Safety Report, the NTSB's accident statistics and research dashboards, and AOPA's McSpadden Report for U.S. general aviation safety statistics. National civil aviation authorities like the FAA and EASA also publish safety data regularly.
Conclusion: What Average Plane Crash Statistics Mean for BlackJet Travelers
Aviation accidents and fatal crashes per year have fallen to historically low levels. Scheduled commercial airlines now operate with a safety record that would have been unimaginable in the 1970s, and professionally managed charter operations have followed the same trajectory. The data is clear: flying, whether commercial or through a vetted private operator, carries a fraction of the risk of everyday road travel.
General aviation still generates the majority of aircraft accidents, which underscores why the choice of operator matters. Informal, lightly regulated private flying carries measurably higher risk than structured programs with documented safety standards, professional crews, and modern fleets.
BlackJet offers a way to access the core benefits of private flying—control, privacy, and time savings—while aligning with the best practices of commercial airline safety and sustainability. Every flight is carbon-neutral. Every operator is vetted. Every journey is supported around the clock.
Elevate your travel on your terms. Explore BlackJet's Jet Card programs and discover how structured private jet access can transform the way you move through the world.


 Sign up with google
 Sign up with Apple